This tutorial demonstrates how to hook up a 128×64 graphics LCD display to a Raspberry Pi.
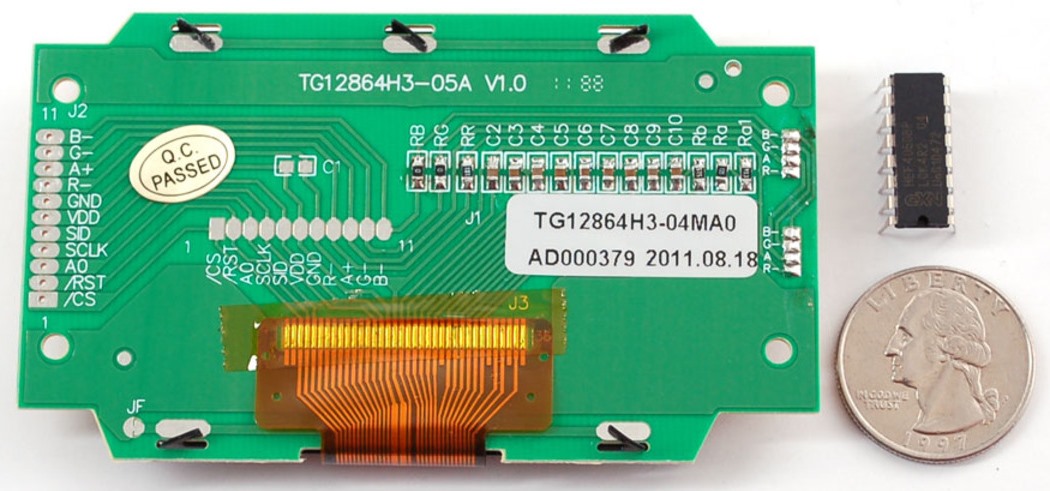
I have another tutorial if you are interested in 16×2 LCD Displays with the Pi. Unlike the 16×2 which is primarily simple text, the graphics LCD makes it easy to draw graphics, different size text in any font and even play games or show animations. This is the Adafruit ST7565 graphics negative LCD display:
It can be powered directly from the Pi’s 3.3 V rail. It requires 5 GPIO pins for data. The display has a negative RGB back light which allows you change the foreground color. An additional 3 GPIO pins are required if you want to control the color from the Pi.
Here is a simplified wiring schematic. CS (Chip Select), RST (Reset) and A0 (Register Select) can be connected to any 3 GPIO pins. I’m using 8, 25 and 24 respectively which are the default values. Different values can be specified as parameters when you instantiate the ST7565 Python class. SCLK (Serial Clock) on the GLCD goes to GPIO 11 which is the Pi’s serial clock. SID (Serial Input Data) on the GLCD goes to GPIO 10 on the Pi which is MOSI. You must use GPIO 10 and 11 for SID and SCLK. Vdd is connected to a 3.3 V pin on the Pi and the grounds are also connected.
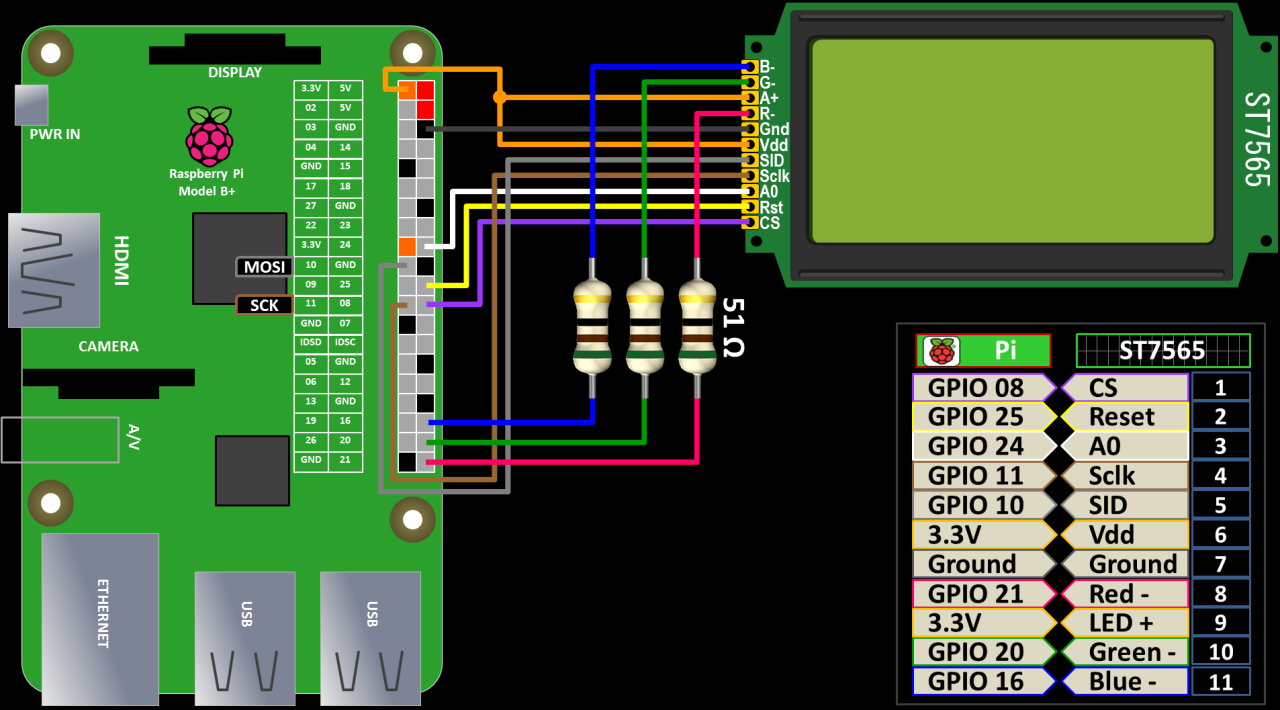
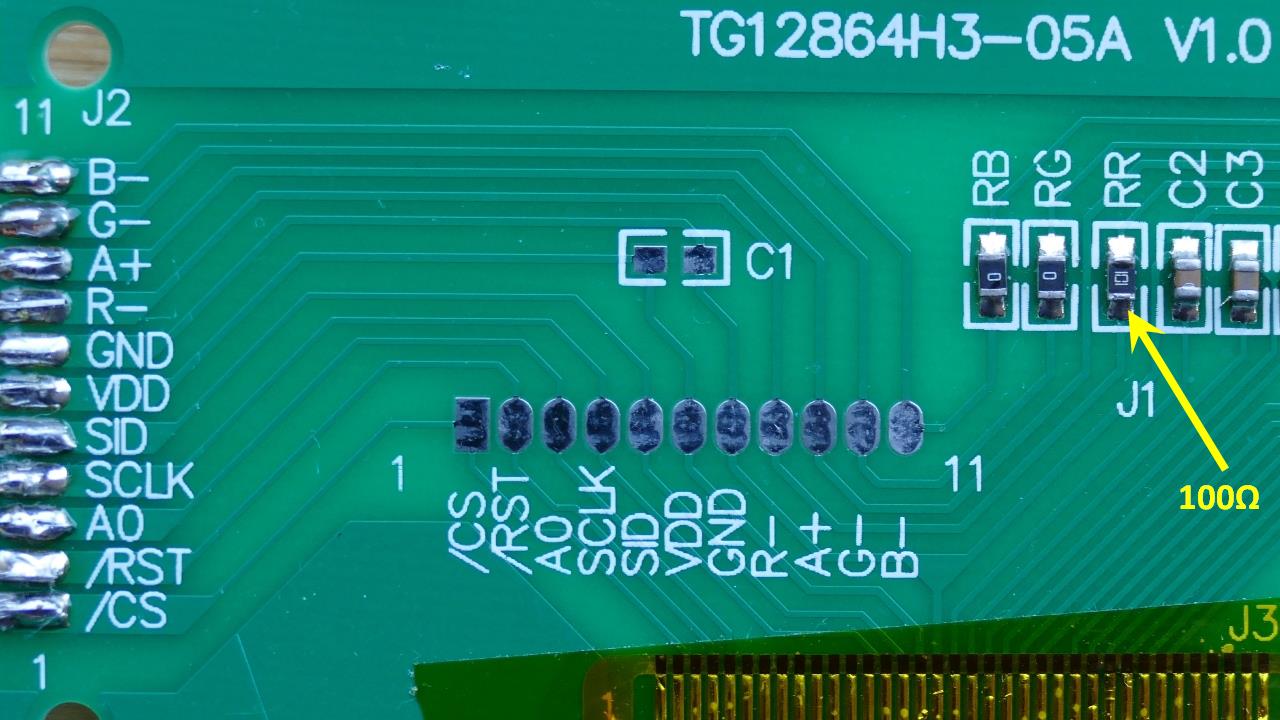
The RGB back light LED pins can go to GPIO’s 16, 20 and 21. You can use any GPIO pins for these (in the video I used 8, 10 & 11). There are no default values. To control the color from the Pi you must specify the RGB pins when you instantiate the ST7565 class. Resistors are placed in series to limit the current. I’m using 51 Ω which provides ample brightness. Since the back light is common anode, the back light anode a+ pin is connected to the Pi’s 3.3 V power. The back light LED’s are turned on by grounding the cathode pins. You could go brighter with lower ohm resistors but you would need to use transistors because you do not want to exceed the maximum GPIO current which I believe is 16 mA per pin with a combined total not to exceed 50 mA. Please note that the display has a 100 Ω resistor built-in on the red channel. The resistor is visible on the back of the display and is not mentioned in the datasheet.
The display is 128 pixels wide by 64 pixels high. The display is broken into 8 horizontal pages. The pages are confusingly numbered from the center 0 to 3 and 7 to 4. Each page is comprised of 128 columns of 8 vertical pixels. To address the pixels you specify the page and the column number and then send a byte to fill 8 vertical pixels at once.
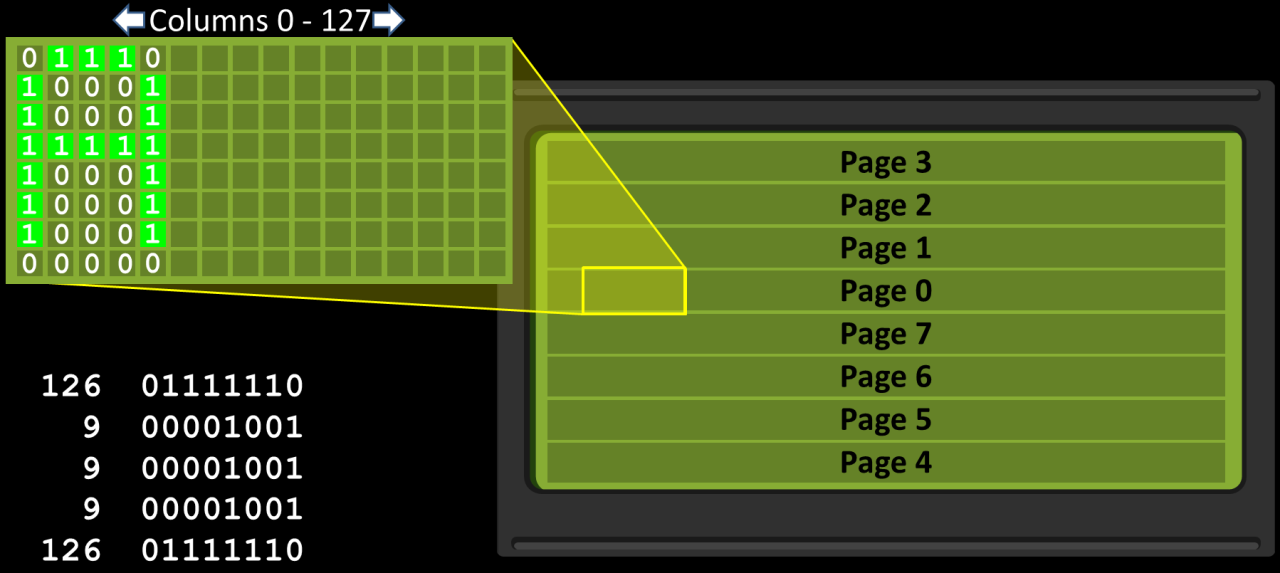
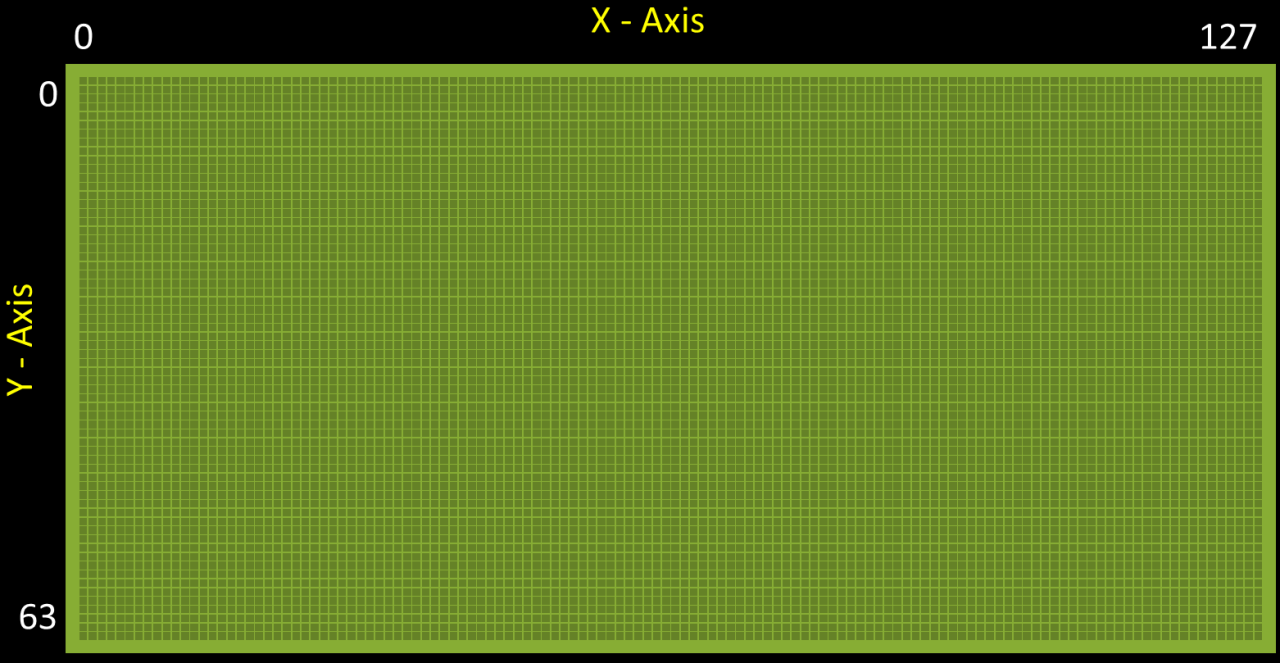
Don’t worry if this seems confusing because I went ahead and wrote a Python library to handle all the drawing for you. It uses a back buffer that can be addressed with simple X, Y coordinates. And just for the record, this display has a 9th page on the bottom but it only has 1 row of pixels so I omitted it to make the programming easier.
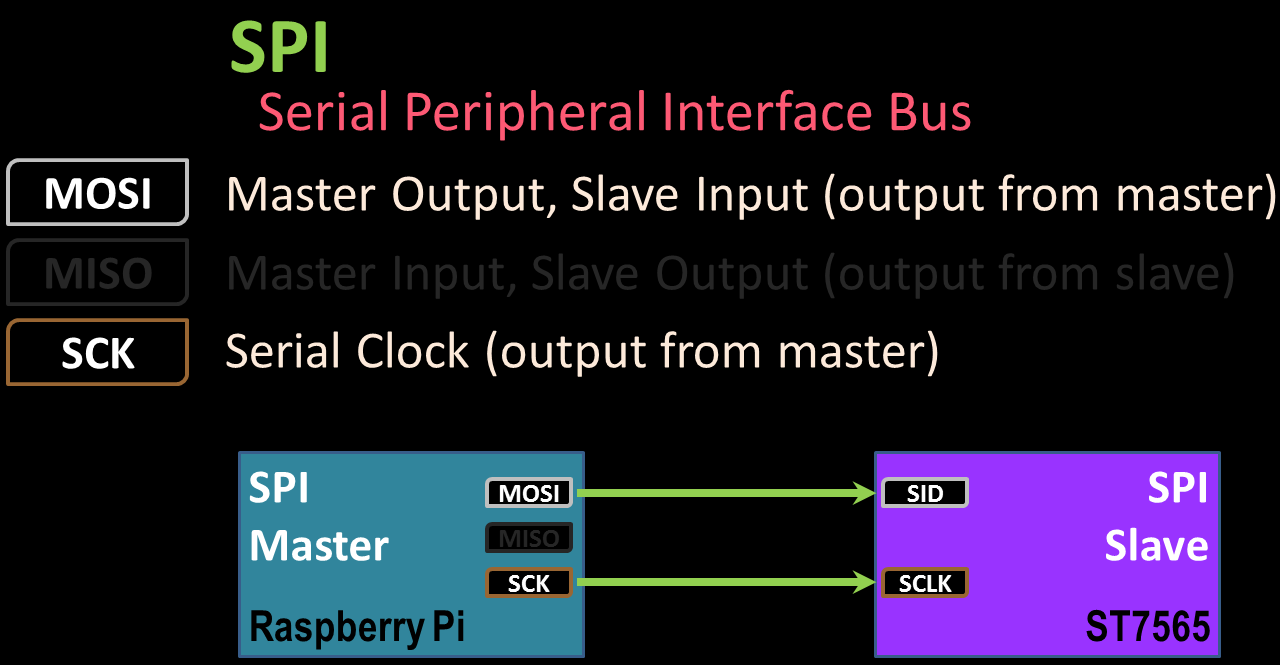
The display is connected to the Pi using SPI which stands for Serial Peripheral Interface. My previous tutorial on AVR programming with the Pi details SPI which usually requires 3 lines MOSI, MISO and Clock. The Pi is the master and the GLCD is the slave. Since we are only writing to the GLCD and not reading, we only need to connect the MOSI and Clock lines. MOSI is the output from the pi to the GLCD and the clock synchronizes the timing.
Before using SPI on the Raspberry Pi, we have to enable it with raspi-config. From a terminal:
sudo raspi-config
From the raspi-config menu, select Advanced Options; then SPI. Select Yes for “Would like the SPI interface to be enabled”. Hit OK a reboot is required and Yes for “the SPI kernel module to be loaded by default”. Please reboot the Pi after enabling SPI.
After rebooting, you can test that SPI is enabled using lsmod:
lsmod | grep spi
It should return spi_bcm2708 or spi_bcm2835 depending on your Pi version.
The python SPI library requires python2.7 dev which can be installed with apt-get install:
sudo apt-get install python2.7-dev
The python SPI library is called py-spidev. Currently the doceme fork seems to be the most up-to-date. It can be installed using git:
cd~
git clone https://github.com/doceme/py-spidev.git
cd py-spidev
sudo python setup.py install
My GLCD Python library for the Pi can be downloaded from my GitHub site:
cd~
git clone https://github.com/rdagger/Pi-ST7565.git
I didn’t write an install because it’s only 2 files. You can place them in the same folder as your program or append the system path with their location. The main ST7565 library (st7565.py) which handles drawing, text & bitmaps, and a font module (xglcd_font.py) to load X-GLCD fonts.
Here are the basic drawing commands which allow you to create points, lines, rectangles, circles, ellipses and regular polygons:
draw_point(x, y, color=1, invert=False)
is_point(x, y)
draw_line(x1, y1, x2, y2, color=1, invert=False)
draw_lines(coords, color=1, invert=False)
draw_rectangle( x1, y1, w, h, color=1, invert=False)
fill_rectangle(x1, y1, w, h, color=1, invert=False)
fill_circle(x0, y0, r, color=1)
draw_circle(x0, y0, r, color=1)
draw_ellipse(x0, y0, a, b, color=1)
fill_ellipse(x0, y0, a, b, color=1)
draw_polygon(sides, x0, y0, r, rotate=0, color=1)
fill_polygon(sides, x0, y0, r, rotate=0, color=1, invert=False)
Methods starting with draw are for outlines and fill for solids. For example, draw_rectangle draws a rectangle outline. X1, Y1 is the top left corner. W & H are the width and height. There is also the fill_rectangle method which has the same parameters but draws a solid filled rectangle. The color parameter can be 1 which turns the pixels on or zero which turns the pixels off. The actual color would depend on the LED back light.
The invert parameter toggles the existing pixel state on the buffer. If the pixel is off, it will turn it on and if it is already on it will turn it off. This overrides the color parameter. It allows you to see where a shape intersects another shape.
The Is Point can be used to determine the state of a current pixel. It returns true if the pixel at location X, Y is illuminated or false if it is turned off. I use it in my Artillery Duel game to determine if a projectile has hit another object.
I commented the methods pretty well and I added docstrings detailing all the parameters and usage if you need more help. Here are some basic LCD commands:
clear_display()
clear_back_buffer()
flip()
set_backlight_color(r, g, b)
set_contrast(level)
sleep()
standby(exit=False)
wake()
Clear_display clears the GLCD. Clear back buffer clears the back buffer. You would issue both clear commands to start with a clean slate. Flip sends the back buffer to the display. I probably should have named the flip method present because the buffer is copied to the display and not swapped.
Set_backlight_color allows you to change the LED back light color. The RGB values are specified in percentage points 0 to 100. The software uses pulse width modulation to control the LED’s for greater color range. It also enables you to change the brightness of the display. You must specify the RGB pins when you instantiate the class to enable color control from software. Set contrast changes the display contrast. A great feature of this display is the ability to control brightness and contrast in software. Sleep and wake take the display in and out of power saving mode which uses less power than the standby mode.
Here is an example that draws rectangular border around the display. Don’t forget to initialize the display after importing and instantiating it. Also please note that all drawing commands operate on the back buffer. Nothing will appear on the display until you fire the flip command.
import st7565
glcd = st7565.Glcd()
glcd.init()
glcd.draw_rectangle(0, 0, 128, 64)
glcd.flip()
There are 2 text methods:
draw_letter(self, letter, font, x, y, invert = False, landscape=True)
draw_string(self, text, font, x, y, spacing = 1, invert = False, landscape=True)
Draw letter draws a single letter. You can specify an X-GLCD font. X, Y are the top left coordinates of the letter. Invert acts a little different from the drawing commands. It just inverts the letter (dark text on an illuminated background.) Landscape draws text along the long axis of the display. If set to false the text is rotated and drawn along the short axis. Draw string, draws a string of characters. You can specify pixel spacing between letters.
You can load X-GLCD fonts for the text commands using my xglcd_font module. You must specify the font pixel height and width.
import xglcd_font as font
fixed = font.XglcdFont('/home/pi/Pi-ST7565/fonts/FixedFont5x8.c', 5, 8)
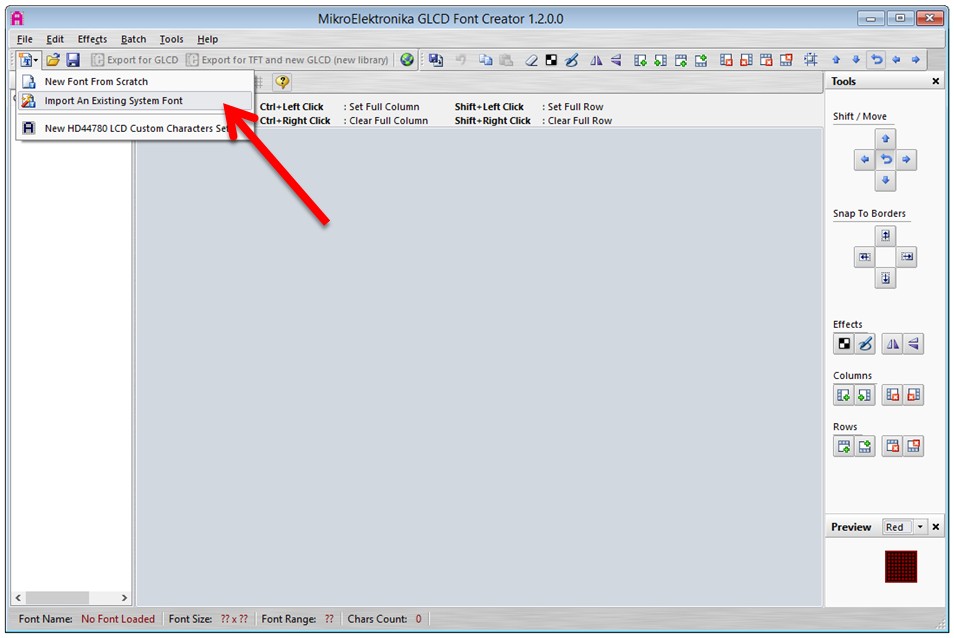
Several fonts are included with my library. Plus, you can convert most TrueType fonts to X-GLCD format using the free edition of MikroElektronika GLCD Font Creator. Click Import an Existing System Font to load any TrueType font on your system.
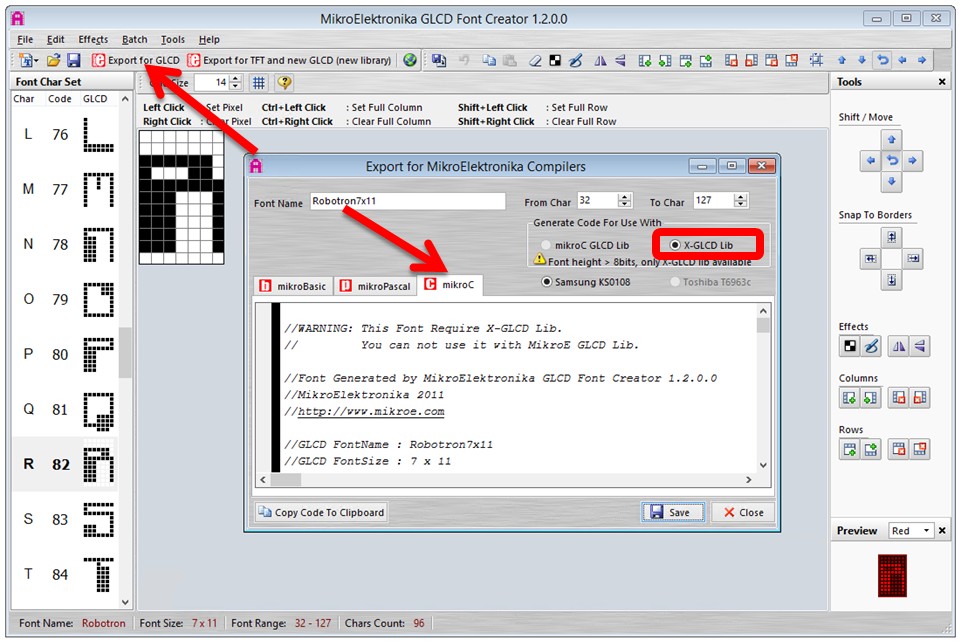
The default options should be OK. You might want to change the font size. Once loaded there is a rich set of features to edit the font characters. Click Export to GLCD to start the conversion. Make sure you select the mikroC tab and X-GLCD lib format. Then click save. I like to include the font pixel width and height in the name because you’ll need it later to load the font.
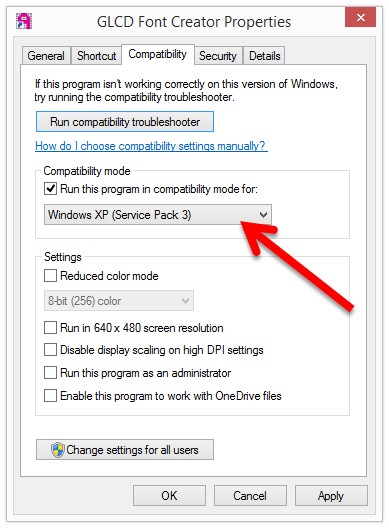
Unfortunately, this program is Windows only. Also if you are using a version higher than XP, you’ll need to run GLCD Font Creator in XP compatibility mode or else the save button will not work. Right click on the program shortcut and click properties. Select the compatibility tab and choose Run this program in compatibility mode for: Windows XP (Service Pack 3):
My GLCD library also supports drawing bitmaps to the display:
draw_bitmap(bitmap, x=0, y=0)
load_bitmap(path, width=LCD_WIDTH, height=LCD_HEIGHT, invert=False)
save_bitmap(path, x1=0, y1=0, width=LCD_WIDTH, height=LCD_HEIGHT)
Draw_bitmap draws a 2d array of pixels where X, Y are the top left corner of the image. Load_bitmap is used to load a bitmap file into a 2d NumPy pixel array. Path is the location of the bitmap file. You have to specify the actual pixel width and height of the bitmap if the dimensions do not equal the size of the display. Save_bitmap saves the screen to a raw bitmap file.
Only raw 8-bit monochrome bitmaps are supported, but you can convert graphics files such as JPEG to raw format using IRFanView for Windows or with GIMP which works on MAC and Linux too. Both programs are free.


In GIMP, you would click Image -> Flatten Image. Then click Image -> Mode -> Indexed. Select Use black and white (1-bit) palette. Click Export and choose Raw image data under Select File Type.
In IrfanView, you would click Image -> Decrease Color Depth. Select 2 Colors (black/white)(1 bpp). Click Save As and specify Raw Image Data for the type.
The image pixel size cannot be larger than the GLCD screen size. The file size of the raw bitmaps should equal the pixel width times the pixel height. For example, if you convert a 32×32 JPEG, the new raw bitmap file should be 1,024 bytes (32 X 32 = 1,024). If it doesn’t then something went wrong during the conversion.
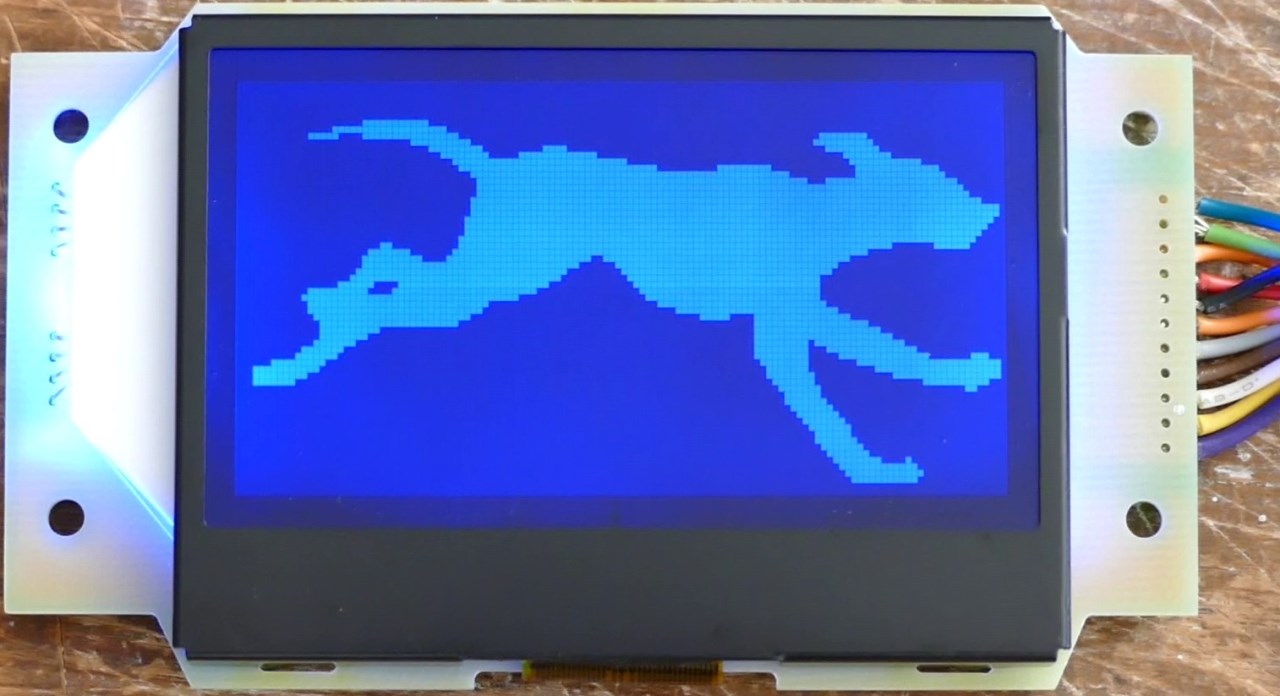
I’ve included 3 Python example programs with my ST7565 library. The first is example_bitmaps.py:
import st7565
from pygame import time
clock = time.Clock()

glcd = st7565.Glcd(rgb=[21,20,16])
glcd.init()
glcd.set_backlight_color(0, 0, 100)

path = "/home/pi/Pi-ST7565/images/"
# Use List comprehension to load raw bitmaps to list
dogs = [glcd.load_bitmap(path + "dog{0}.raw".format(i)) for i in range(1,8)]

while 1:
    for dog in dogs:
        glcd.draw_bitmap(dog)
        glcd.flip()
        clock.tick(4)
The program loads 7 raw bitmap images into a list and then loops through them to generate an animation of a dog running.
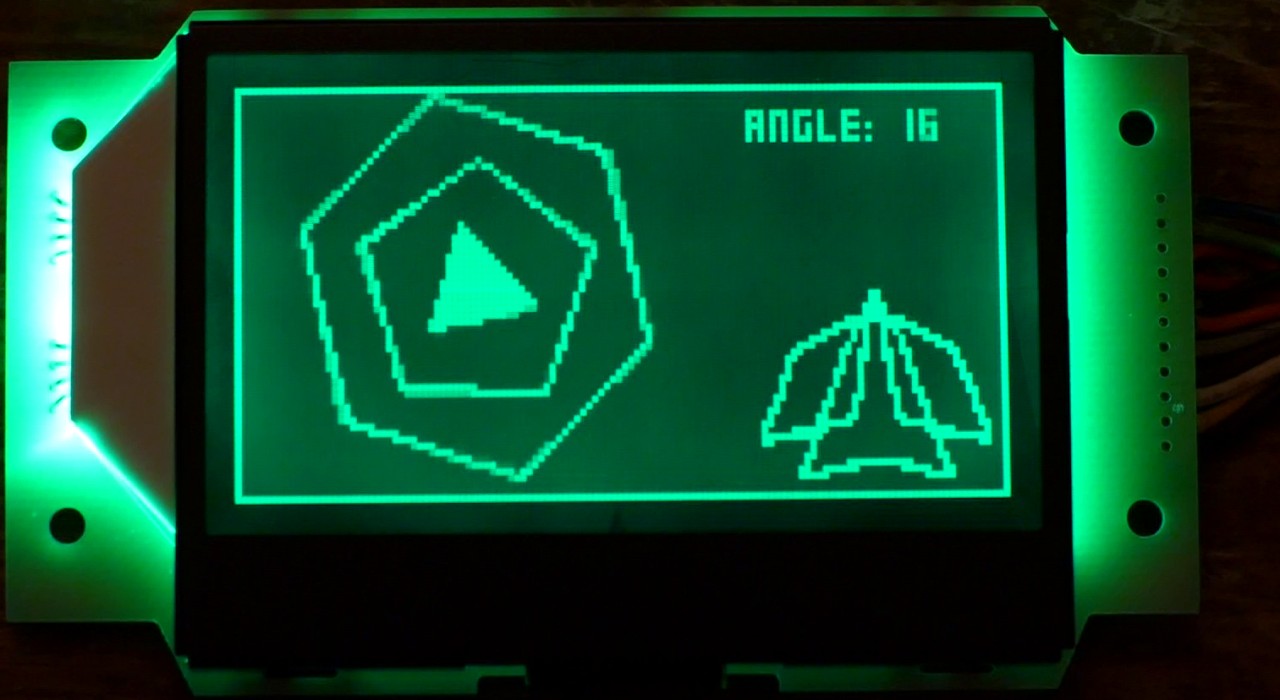
The next example is example_polygons.py.
import st7565
import xglcd_font as font
from time import sleep

glcd = st7565.Glcd(rgb=[21,20,16])
glcd.init()
glcd.set_backlight_color(0, 100, 0)
x0, y0 = 40, 31
rout, rmid, rin = 30, 20, 10
incr = 2
path = "/home/pi/Pi-ST7565/"
wendy = font.XglcdFont(path + 'fonts/Wendy7x8.c', 7, 8)
ship = glcd.load_bitmap(path + 'images/ship_38x29.raw',
                        width=38, height=29, invert=True)

for angle in range(0, 360, incr):
    glcd.clear_back_buffer()
    glcd.draw_rectangle(0, 0, 128, 64)
    glcd.draw_string("Angle: {0}".format(angle), wendy, 85, 2,spacing=0)
    glcd.draw_bitmap(ship, 87, 32)

    glcd.draw_polygon(6, x0, y0, rout, rotate=angle-180, color=1)
    glcd.draw_polygon(5, x0, y0, rmid, rotate=-angle, color=1)
    glcd.fill_polygon(3, x0, y0, rin, rotate=angle, color=1)

    glcd.draw_polygon(6, x0, y0, rout, rotate=angle-180 + incr, color=1)
    glcd.draw_polygon(5, x0, y0, rmid, rotate=-angle - incr, color=1)
    glcd.fill_polygon(3, x0, y0, rin, rotate=angle + incr, color=1)

    glcd.flip()
    sleep(.01)

glcd.cleanup()
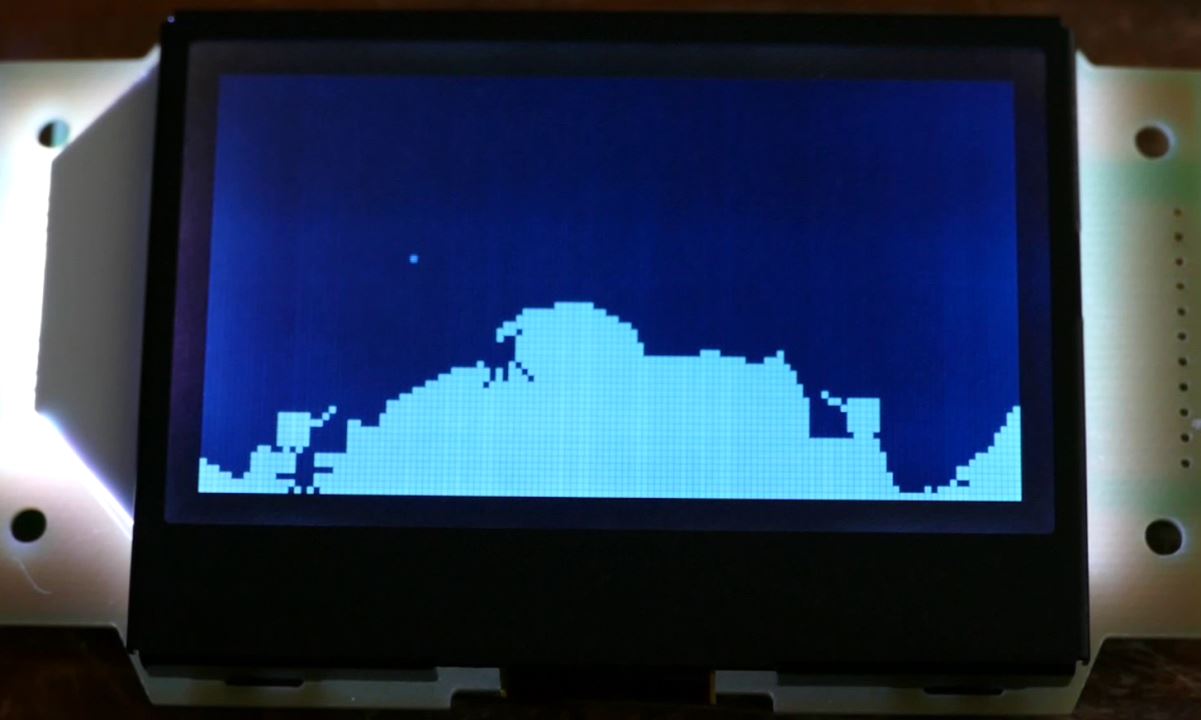
The program demonstrates rotating different size regular polygons. It also uses text to display the angle and draws a small space ship in the corner. Each loop draw the polygons twice at the current and previous position. This makes for a more fluid animation.
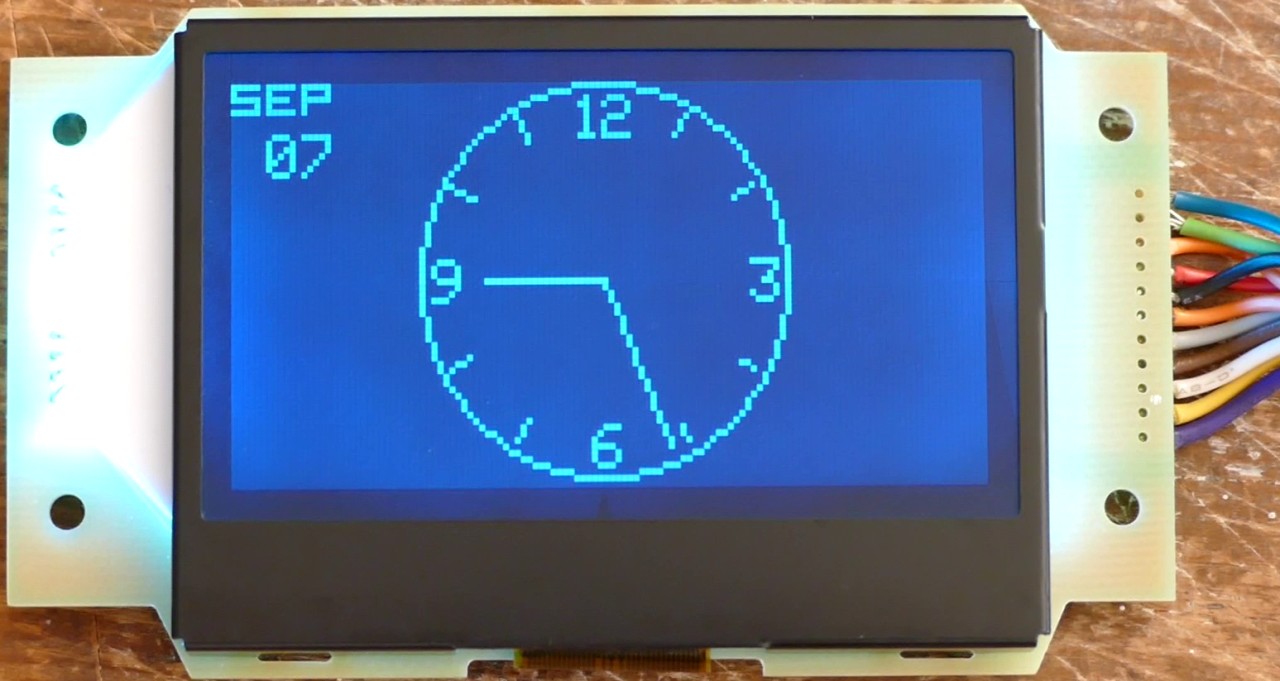
The last example is example_clock.py which creates an analog clock with digital date read out:
import st7565
import xglcd_font as font
import math
import time

neato = font.XglcdFont('/home/pi/Pi-ST7565/fonts/Neato5x7.c', 5, 7)
glcd = st7565.Glcd(rgb=[21,20,16])
glcd.init()
x0, y0 = 63, 31

def get_face_xy(angle, radius):
    """
    Get x,y coordinates on face at specified angle and radius
    """
    theta = math.radians(angle)
    x = int(x0 + radius * math.cos(theta))
    y = int(y0 + radius * math.sin(theta))
    return x, y

def draw_face():
    # Outline
    glcd.draw_circle(x0, y0, 31)
    # Ticks
    for angle in range(30, 331, 30):
        glcd.draw_line(x0, y0, *get_face_xy(angle, 29))
    # Clear center of circle
    glcd.fill_circle(x0, y0, 25, color=0)
    # Numbers
    glcd.draw_string("12", neato, x0 - 5, y0 - 29, spacing=0)
    glcd.draw_letter("3", neato, x0 + 25, y0 - 3)
    glcd.draw_letter("6", neato, x0 - 2, y0 + 23)
    glcd.draw_letter("9", neato, x0 - 29, y0 - 3)
    # Date
    glcd.draw_string(time.strftime("%b").upper(), neato, 0,0)
    glcd.draw_string(time.strftime(" %d"), neato, 0, 8)

while 1:
    glcd.clear_back_buffer()
    draw_face()
    minute = int(time.strftime("%M"))
    hour = int(time.strftime("%H"))
    glcd.draw_line(x0, y0, *get_face_xy(minute * 6 + 270, 29))
    glcd.draw_line(x0, y0, *get_face_xy(hour * 30 - 90, 20))
    glcd.flip()
    while minute == int(time.strftime("%M")):
        time.sleep(1)
The main loop draws the clock face and the date display. Then the draw_line method is used for the minute and hour hands. It repeats when the minute changes.